Íomhá:Projected Change in Temperatures.svg

Page contents not supported in other languages.
Ón Vicipéid, an chiclipéid shaor.

Taispeáin leagan ardtaifigh den íomhá(Comhad SVG, ainmniúil 960 × 960 picteilíni, méid comhaid: 1.07 MB)

Seo comhad as An Cómhaoin Viciméid. Tá an tuairisc as an leathanach tuairisc Cómhaoin a leanas thíos.
Is stór comhaid meáin Saor é an Cómhaoin Viciméid. Is féidir leat cabhrú.

Achoimriú

Tuairisc
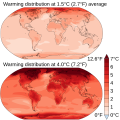
English: Coupled Model Intercomparison Project Phase 6 (CMIP6) multi-model mean projections (i.e., the average of the model projections available). Changes are shown relative to the 1850-1900. Data from the IPCC Sixth Assessment Report SPM.5. Note that maps were only produced for temperatures at 1C, 1.5C, 2C, and 4C. This graphic uses 1.5C and 4C as they average to the 2.7C that is the most likely outcome.
Français : Projections moyennes multimodèles de la phase 6 du projet d'intercomparaison de modèles couplés (CMIP6) (= moyenne des projections de modèles disponibles). Les changements sont indiqués par rapport à l'ère préindustrielle (1850-1900). Données du sixième rapport d'évaluation du GIEC SPM.5
Dáta
Foinse Obair féin
Údar Efbrazil
Leaganacha eile French version

Ceadúnú

Is mise sealbhóir cóipchirt an shaothair seo agus foilsím é faoin gceadúnas seo a leanas:
w:ga:Creative Commons
sannadh comhroinn araon
This file is licensed under the Creative Commons Attribution-Share Alike 4.0 International license.
Is féidir:
  • an saothar seo a roinnt – an saothar seo a chóipeáil, a dháil amach, agus a tharchur
  • an saothar seo a athmheascadh – an saothar seo a oiriúnú
Ach amháin má leantar na coinníollacha seo a leanas:
  • sannadh – Ní mor creidiúint a thabhairt leis an saothar, faoi mar a shonraigh an údar nó tabharthóir an ceadúnais (ach ná húsáid modh a thugann le fios go thacaíonn sé/sí tú féin nó an úsáid a bhaineann tú as an saothar).
  • comhroinn araon – Má athraíonn tú nó síneann tú amach an saothar seo, ní féidir é a dháileadh ach amhaín faoin gceadúnas céanna nó ceann cosúil leis an gceann seo.

These maps contain data from the IPCC that is not believed to be subject to their copyright. According to the wikimedia article discussing derivative works using maps none of the following are subject to copyright: data, colors, systems, and geographical boundaries. That covers all that these maps display- they are standard world maps colored to show expected temperature changes according to climate change models.

Captions

Add a one-line explanation of what this file represents
Distribution of temperature changes as predicted by the IPCC in AR6 relative to 1850-1900 baseline

Items portrayed in this file

taispeánann sé/sí

9 Márta 2020

Stair chomhaid

Cliceáil ar dáta/am chun an comhad a radharc mar a bhí sé ag an am sin.

Dáta/AmMionsamhailToisíÚsáideoirNóta tráchta
faoi láthair11:43, 1 Lúnasa 2023Mionsamhail do leagan ó 11:43, 1 Lúnasa 2023960 × 960 (1.07 MB)Jirka DlFile uploaded using svgtranslate tool (https://svgtranslate.toolforge.org/). Added translation for cs.
19:55, 18 Lúnasa 2021Mionsamhail do leagan ó 19:55, 18 Lúnasa 2021960 × 960 (1.07 MB)EfbrazilUpdated to AR6
16:00, 13 Bealtaine 2020Mionsamhail do leagan ó 16:00, 13 Bealtaine 2020960 × 960 (1.74 MB)NyqDecapitalized common nouns
18:25, 30 Márta 2020Mionsamhail do leagan ó 18:25, 30 Márta 2020960 × 960 (1.74 MB)EfbrazilVery fiddly tweak, changed positioning / size of CO2 subscript
17:17, 30 Márta 2020Mionsamhail do leagan ó 17:17, 30 Márta 2020960 × 960 (1.74 MB)EfbrazilDropping space between RCP and number as per review
18:04, 9 Márta 2020Mionsamhail do leagan ó 18:04, 9 Márta 2020960 × 960 (1.74 MB)EfbrazilUploaded own work with UploadWizard

Níl nasc ó aon leathanach eile don íomhá seo.

Global file usage

Meiteasonraí