
Íomhá:Changes in total solar irradiance and monthly sunspot numbers, 1975-2013.png
Size of this preview: 796 × 600 picteilín. Other resolutions: 319 × 240 picteilín | 637 × 480 picteilín | 1,020 × 768 picteilín | 1,280 × 964 picteilín | 2,318 × 1,746 picteilín.
Taispeáin leagan ardtaifigh den íomhá (2,318 × 1,746 picteilín, méid comhaid: 289 KB, cineál MIME: image/png)
| Seo comhad as An Cómhaoin Viciméid. Tá an tuairisc as an leathanach tuairisc Cómhaoin a leanas thíos.
|
Achoimriú
| Tuairisc |
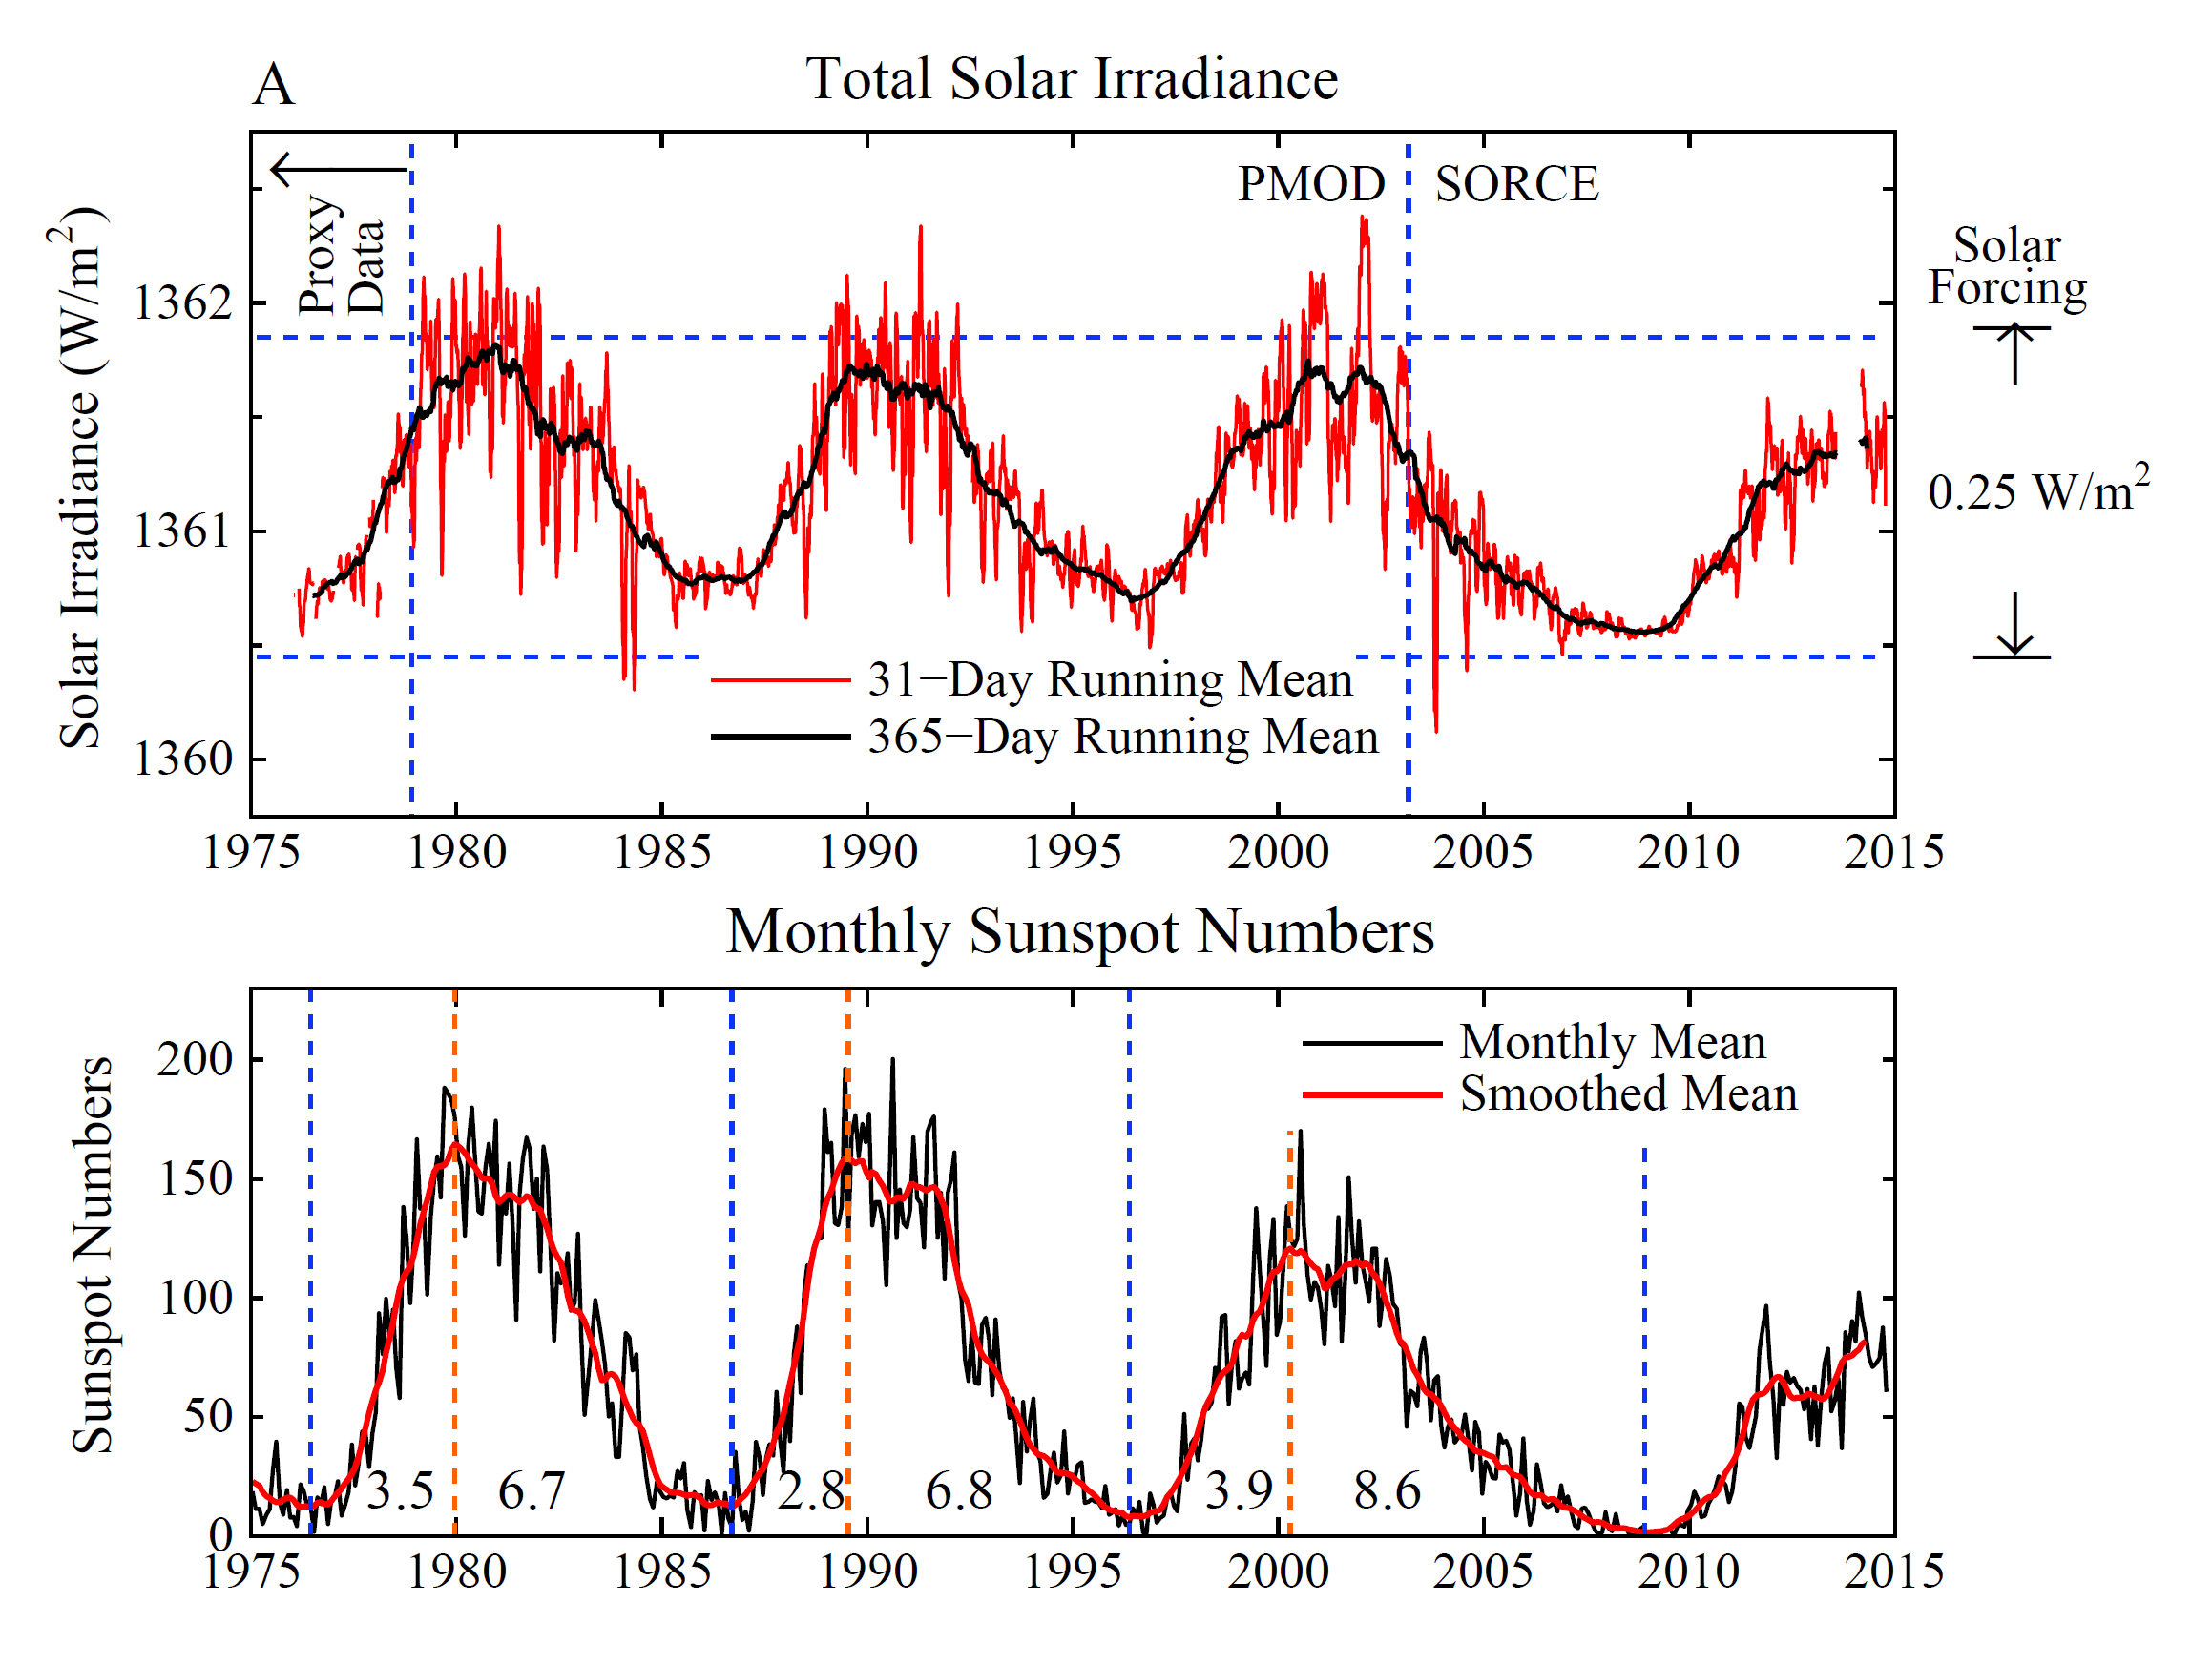
English: These two graphs show changes in total solar irradiance (TSI, labelled "A") and monthly sunspot numbers ("B") between approximately 1975 to 2013. TSI is measured in watts per square metre (W.m-2), with 31-day and 365-day running means plotted. The 31-day mean shows more variability than the 365-day mean. Both curves show a pattern of peaks and troughs (see: solar cycle). The range of changes in solar forcing (365-day mean) over the time period is 0.25 W.m2.
Graph B plots a monthly mean and smoothed mean, with the monthly mean showing more variability than the smoothed mean. The pattern of peaks and troughs in total solar irradiance is replicated in this graph of monthly sunspot numbers. A summary of the data is given in a later section. |
| Dáta | |
| Foinse |
|
| Údar | Hansen J, Kharecha P, Sato M, Masson-Delmotte V, Ackerman F, et al. |
Data
Values are approximate. See Hansen et al. for original data sources. For TSI and monthly sunspot numbers, data are given for the 365-day mean and smoothed mean, respectively. Values are given that correspond to peaks and troughs in the curves, as well as values at the beginning and end of the time period (approximately 1977 and 2014).
| Year | TSI |
|---|---|
| 1977 | 1360.75 |
| 1981 | 1361.85 |
| 1986 | 1360.75 |
| 1991 | 1361.6 |
| 1996 | 1360.75 |
| 2001 | 1361.7 |
| 2009 | 1360.55 |
| 2013 | 1361.35 |
| Year | Sunspot No. |
|---|---|
| 1977 | 15 |
| 1980 | 160 |
| 1987 | 15 |
| 1991 | 145 |
| 1997 | 10 |
| 2001 | 105 |
| 2009 | 3 |
| 2014 | 85 |
Ceadúnú
| This file is made available under the Creative Commons CC0 1.0 Universal Public Domain Dedication. | |
| The person who associated a work with this deed has dedicated the work to the public domain by waiving all of their rights to the work worldwide under copyright law, including all related and neighboring rights, to the extent allowed by law. You can copy, modify, distribute and perform the work, even for commercial purposes, all without asking permission.
|
| Annotations | This image is annotated: View the annotations at Commons |
Stair chomhaid
Cliceáil ar dáta/am chun an comhad a radharc mar a bhí sé ag an am sin.
| Dáta/Am | Mionsamhail | Toisí | Úsáideoir | Nóta tráchta | |
|---|---|---|---|---|---|
| faoi láthair | 07:49, 21 Samhain 2014 | | 2,318 × 1,746 (289 KB) | Enescot | {{Information |Description ={{en|1=These two graphs show changes in total solar irradiance (TSI, labelled "A") and monthly sunspot numbers ("B") between approximately 1975 to 2013. TSI is measured in wa... |
Úsáid comhaid
Tá nasc chuig an gcomhad seo ar na leathanaigh seo a leanas:
Global file usage
The following other wikis use this file:
- Úsáid ar de.wikipedia.org
- Úsáid ar es.wikipedia.org