
Íomhá:20201211 Billion dollar events related to climate change - U.S. -en.svg

Taispeáin leagan ardtaifigh den íomhá (Comhad SVG, ainmniúil 1,200 × 675 picteilíni, méid comhaid: 4 KB)
| Seo comhad as An Cómhaoin Viciméid. Tá an tuairisc as an leathanach tuairisc Cómhaoin a leanas thíos.
|
Achoimriú
| Tuairisc |
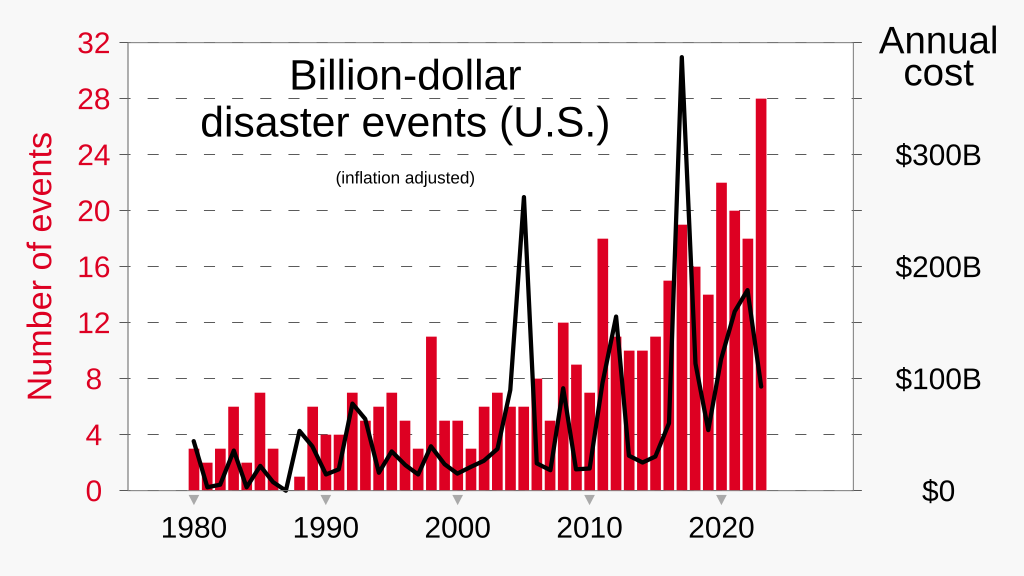
English: Graph of number billion-dollar climate-related events in the United States, and annual costs of those events, based on NOAA's National Centers for Environmental Information.
|
| Dáta | |
| Foinse | Obair féin |
| Údar | RCraig09 |
.png)
Source data
Data through 2023:
| Click at right to show/hide data |
|---|
|
Year — Disasters Count — Cost
|
Ceadúnú
- Is féidir:
- an saothar seo a roinnt – an saothar seo a chóipeáil, a dháil amach, agus a tharchur
- an saothar seo a athmheascadh – an saothar seo a oiriúnú
- Ach amháin má leantar na coinníollacha seo a leanas:
- sannadh – Ní mor creidiúint a thabhairt leis an saothar, faoi mar a shonraigh an údar nó tabharthóir an ceadúnais (ach ná húsáid modh a thugann le fios go thacaíonn sé/sí tú féin nó an úsáid a bhaineann tú as an saothar).
- comhroinn araon – Má athraíonn tú nó síneann tú amach an saothar seo, ní féidir é a dháileadh ach amhaín faoin gceadúnas céanna nó ceann cosúil leis an gceann seo.
Stair chomhaid
Cliceáil ar dáta/am chun an comhad a radharc mar a bhí sé ag an am sin.
| Dáta/Am | Mionsamhail | Toisí | Úsáideoir | Nóta tráchta | |
|---|---|---|---|---|---|
| faoi láthair | 04:54, 13 Eanáir 2024 | | 1,200 × 675 (4 KB) | RCraig09 | Version 9: revise to include data newly changed on NOAA website (25 ---> 28 events . . . . and $81.0B ---> $92.9B) |
| 21:13, 1 Eanáir 2024 |  | 1,200 × 675 (4 KB) | RCraig09 | Version 8: update to include 2023 data | |
| 17:09, 15 Eanáir 2023 |  | 1,200 × 675 (4 KB) | RCraig09 | Version 7: change shade of red (avoiding the "primary color" tendency that's apparently falling into disfavor) | |
| 05:50, 31 Nollaig 2022 |  | 1,200 × 675 (4 KB) | RCraig09 | Version 6: update to include data for 2022 | |
| 22:53, 12 Eanáir 2022 |  | 1,200 × 675 (4 KB) | RCraig09 | Version 5: change scale on right, so red and black traces occupy about the same vertical space | |
| 06:31, 12 Eanáir 2022 |  | 1,200 × 675 (5 KB) | RCraig09 | Version 4: update to include 2021 data . . . changing width/height ratio | |
| 18:08, 22 Feabhra 2021 |  | 1,000 × 630 (43 KB) | RCraig09 | Version 3: changed background shading so graph area is white and border is opaque light-gray | |
| 20:27, 8 Eanáir 2021 |  | 1,000 × 630 (42 KB) | RCraig09 | Version 2: updating to include data through ENTIRE YEAR 2020 (not just through the Sept 2020 data that was in Version 1). | |
| 06:26, 12 Nollaig 2020 |  | 1,000 × 630 (41 KB) | RCraig09 | Uploaded own work with UploadWizard |
Úsáid comhaid
Tá nasc chuig an gcomhad seo ar na leathanaigh seo a leanas:
Global file usage
The following other wikis use this file:
- Úsáid ar en.wikipedia.org
- Úsáid ar zh.wikipedia.org