
Íomhá:Temperature1900-2004.png

Size of this preview: 800 × 489 picteilín. Other resolutions: 320 × 196 picteilín | 640 × 391 picteilín | 1,024 × 626 picteilín | 1,280 × 782 picteilín | 1,875 × 1,146 picteilín.
Taispeáin leagan ardtaifigh den íomhá (1,875 × 1,146 picteilín, méid comhaid: 50 KB, cineál MIME: image/png)
| Seo comhad as An Cómhaoin Viciméid. Tá an tuairisc as an leathanach tuairisc Cómhaoin a leanas thíos.
|
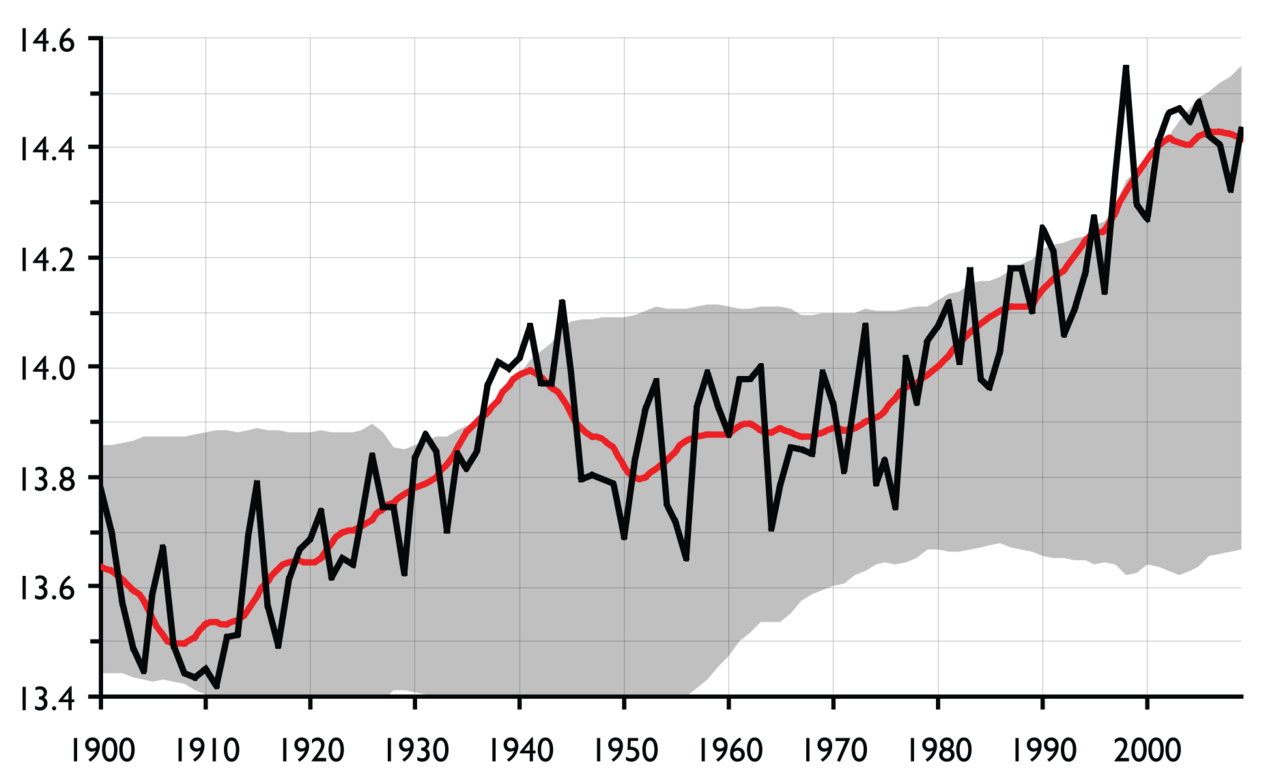
English: Description: Global temperature. Axes are not labelled in order to keep the diagram language neutral; x-axis: year (1900–2009), y-axis: global temperature in °C. The black line is the annual global mean. The red line is the 10-year running mean. The grey area is the 95% confidence interval of the same data, calculated for the 50 years up to and including each year's measurement.
The diagram illustrates several aspects of global warming, the most obvious of which is the increase in mean temperature. However, also the confidence interval has increased both in value (i.e., warmer climate) and in width (i.e., more variable temperature). Periods of rapid change are characterised by many measurements falling outside the confidence intervals. Two such periods can be identified: the late 30's / early 40's, and from the 80's to today. Temperature increase in those periods is due to anthropogenous effects, according to the IPCC.
The diagram illustrates several aspects of global warming, the most obvious of which is the increase in mean temperature. However, also the confidence interval has increased both in value (i.e., warmer climate) and in width (i.e., more variable temperature). Periods of rapid change are characterised by many measurements falling outside the confidence intervals. Two such periods can be identified: the late 30's / early 40's, and from the 80's to today. Temperature increase in those periods is due to anthropogenous effects, according to the IPCC.
Français : Description: Évolution de la température globale planétaire. Les axes ne sont pas étiquetés pour que le graphique reste linguistiquement neutre ; axe des x: année (1900-2009), axe des y: température globale en °C. En noir: moyenne mondiale annuelle. En rouge : moyenne des dix dernières années. Zone grise : intervalle de confiance à 95% des mêmes données (calculé pour les mesures de 50 ans à chaque année).
Le diagramme montre que la température moyenne tend à augmenter, mais avec du "bruit", c'est à dire des variations sur les périodes courtes. Cependant, l’intervalle de confiance a aussi augmenté : en valeur (=> climat plus chaud) et en largeur (=> Température plus variable). Certaines périodes de changement rapide sont caractérisées par de nombreuses mesures situées en dehors des intervalles de confiance. Deux de ces périodes peuvent être identifiées : la fin des années 30 / le début des années 40 et des années 80 à aujourd'hui. L’augmentation de la température pendant ces périodes est due à des effets anthropogènes, selon le GIEC.
- Note: The file name is not "correct" any more, as the graph now ends in 2009 rather than 2004. The estimate for 2009 is based on preliminary values for the first 8 months of the year.
- Source: graph drawn by Hanno using data published on the web (2009) as "HadCRUT3". Met Office Hadley Centre for Climate Change, U.K. [http://www.cru.uea.ac.uk/cru/data/temperature/]
- Licence: released into the public domain by the author
| I, the copyright holder of this work, release this work into the public domain. This applies worldwide. In some countries this may not be legally possible; if so: I grant anyone the right to use this work for any purpose, without any conditions, unless such conditions are required by law. |

|
This graph image could be re-created using vector graphics as an SVG file. This has several advantages; see Commons:Media for cleanup for more information. If an SVG form of this image is available, please upload it and afterwards replace this template with
{{vector version available|new image name}}.
It is recommended to name the SVG file “Temperature1900-2004.svg”—then the template Vector version available (or Vva) does not need the new image name parameter. |
Stair chomhaid
Cliceáil ar dáta/am chun an comhad a radharc mar a bhí sé ag an am sin.
| Dáta/Am | Mionsamhail | Toisí | Úsáideoir | Nóta tráchta | |
|---|---|---|---|---|---|
| faoi láthair | 22:05, 2 Deireadh Fómhair 2016 | | 1,875 × 1,146 (50 KB) | Cmdrjameson | Compressed with pngout. Reduced by 116kB (70% decrease). |
| 18:00, 14 Deireadh Fómhair 2009 |  | 1,875 × 1,146 (166 KB) | Hanno | * '''Description:''' Global temperature. Axes are not labelled in order to keep the diagram language neutral; ''x''-axis: year (1900–2009), ''y''-axis: global temperature in °C. The black line is the annual global mean. The red line is the 10-year | |
| 16:39, 9 Samhain 2005 |  | 1,200 × 780 (120 KB) | Hanno | ||
| 19:13, 26 Deireadh Fómhair 2005 |  | 1,200 × 767 (90 KB) | Hanno | ||
| 11:33, 25 Deireadh Fómhair 2005 |  | 1,200 × 767 (76 KB) | Hanno |
Úsáid comhaid
Tá nasc chuig an gcomhad seo ar na leathanaigh seo a leanas:
Global file usage
The following other wikis use this file:
- Úsáid ar es.wikipedia.org
- Úsáid ar hu.wikipedia.org
- Úsáid ar nn.wikipedia.org